


INTRODUCTION
Obstructive sleep apnea (OSA) in children is a common sleep-related breathing disorder that is characterized by complete or partial reduction of oronasal airflow and oxygen desaturation despite preserved respiratory effort. The prevalence of OSA ranges from 1% to 5% among children in the general population [1,2]. As OSA in children can lead to neurobehavioral disturbances, nocturnal enuresis, reduced somatic growth, and a variety of cardiovascular diseases, the number of studies investigating the appropriate diagnosis and treatment of this disease has gradually increased [3].
The primary mechanism for the development of OSA is the decreased cross-sectional area (CSA) of the upper airway resulting from various anatomical abnormalities [4-7]. Moreover, negative airway pressure is produced as the inhaled air passes through the anatomically narrowed airway during inspiration and causes further obstruction of the upper airway [4,8]. Various parts of the airway passage contribute to the complexity of airway obstruction that is caused by passage narrowing [6,9]. In children, adenotonsillar hypertrophy (ATH), which describes a narrowed upper airway, is considered the most important risk factor for OSA [10].
Acoustic pharyngometry is a quantitative approach to assessing upper airway obstruction. Furthermore, acoustic pharyngometry measures pharyngeal CSA and volume by assessing the oral cavityŌĆÖs and oropharynxŌĆÖs reflex to sound echoes. This technique is based on the transmission of acoustic impulses through the respiratory tract. As the acoustic impulses travel through the upper airways, they are partially reflected in case of a change in the airway CSA. By calculating the reflected acoustic waveŌĆÖs amplitude and movement changes resulting from anatomical alterations and the surface area of the respiratory pathway and comparing it with the original acoustic wave, evaluation of CSA and volume of the upper airway is possible [11]. This method is fast, non-invasive, and reproducible; moreover, several studies have reported the accuracy of the evaluation method in adults because the technique can be easily performed with minimal cooperation from the patients [12,13]. The utility of acoustic pharyngometry in children with OSA has yet to be established. Accordingly, this study aimed to assess the utility of acoustic pharyngometry by comparing changes in measurement data in children with sleep disordered-breathing (SDB) and ATH before and after surgical treatment.
METHODS
Participants
Children with SDB and ATH who were referred to the Korea University Ansan Hospital for adenotonsillectomy were included in this study. Tonsil size was categorized on a 4-grade system (grade 1, tonsil occupies 0%ŌĆō25% of the lateral dimension of the oropharynx; grade 2, 25%ŌĆō50%; grade 3, 50%ŌĆō75%; and grade 4, 75%ŌĆō100%). The adenoid size was also categorized from 1 to 4 based on the degree of nasopharyngeal obstruction (grade 1, adenoid occupies 0%ŌĆō25% of the posterior choana; grade 2, 25%ŌĆō50%; grade 3, 50%ŌĆō75%; and grade 4, 75%ŌĆō100%) on endoscopic examination and lateral cephalometric radiograph view. Children with significant maxillofacial deformities, pulmonary diseases, macroglossia, morbid obesity (body mass index Ōēź 30 kg/m2), previous upper airway surgery, or those who were uncooperative during the evaluation were excluded. Additionally, children with other causes of nasal obstruction (nasal polyps or severe nasal septal deviation) were also excluded from this study. All participants underwent adenotonsillectomy under general anesthesia, performed by a single surgeon (S.H.L). This study was reviewed and approved by the Institutional Ethics Committee of Korea University Ansan Hospital (No. 2017AS0723), and informed consent was obtained from all caregivers and patients.
Acoustic Pharyngometry
Acoustic pharyngometric data were collected before and at least 4 weeks after adenotonsillectomy using an EccoVision acoustic pharyngometer (E. Benson Hood Laboratories, Pembroke, MA, USA). The aforementioned system was used to measure pharyngeal CSA. Estimates of the mean, minimal, and maximal pharyngeal CSA and pharyngeal volume were calculated using the software installed in the device. To ensure the reliability of our examination, one laryngeal pathologist performed acoustic pharyngometry.
According to the method described by Kamal [4], the participants were seated against a straight-back, adjustable chair to maintain the head in a neutral position and asked to breathe comfortably through the oral cavity and maintain a fixed gaze on the opposite wall, while a wave tube was placed inside the mouth, parallel to the floor. For the tongue to remain in its normal relaxed position, the participant was asked to imagine creating an ŌĆ£oohŌĆØ sound. The participants lightly bit the mouthpiece to keep it fixed in position, while the entrance was covered with a lip to prevent air leakage. A standard customized pediatric mouthpiece to fit children was used in this study. The procedure was repeated at least four times for each participant by a single, well-trained examiner to ensure reproducible results. The curves obtained from each trial were averaged. After obtaining the four curves, the child gently breathed out of the nose to define the location of the oropharyngeal junction area, which was determined as the first drop in the acoustic trace. The glottic area was defined as the final drop while the child performed the Valsalva maneuver [8].
Six parameters, including oropharyngeal junction area (OPJ [cm2]), pharyngeal volume (Vp [cm3]), glottic area (GL [cm2]), maximal pharyngeal CSA (Apmax [cm2]), minimal pharyngeal CSA (Apmin [cm2]), and mean pharyngeal CSA (Apmean [cm2]), were measured in this study.
Statistical Analysis
A two-tailed paired t-test was used to compare the changes in acoustic pharyngometry data before and after adenotonsillectomy. All statistical analyses were performed using SPSS version 21 (IBM Corp., Armonk, NY, USA). Differences with p < 0.05 were considered statistically significant.
RESULTS
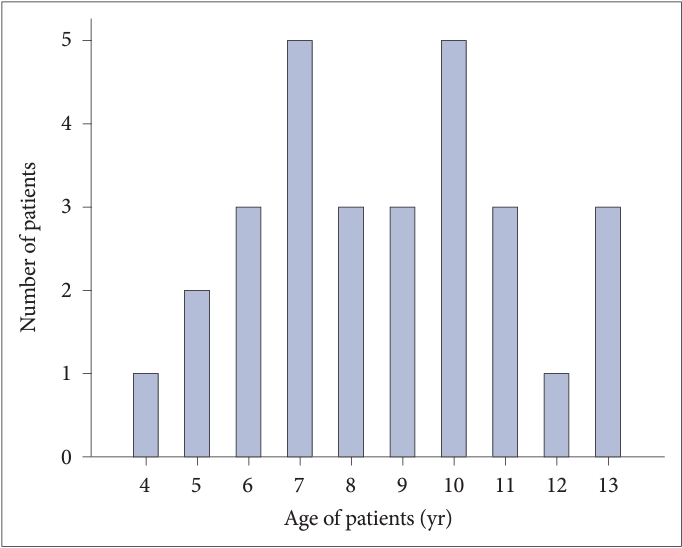
Thirty-five children were enrolled in the study. However, two patients were lost to follow-up. One patient had severe micrognathia, and three patients in whom the customized mouthpiece did not fit were excluded from the study. Ultimately, 29 children (17 males and 12 females; age [mean ┬▒ standard deviation] 8.69 ┬▒ 2.52 years) were enrolled. The demographic information and distribution of tonsil and adenoid sizes of the participants are summarized in Tables 1 and 2. The age distribution of children is displayed in Fig. 1.
After surgery, the mean time to perform follow-up acoustic pharyngometry was 35 days. The changes in acoustic pharyngometry data according to surgery are reported in Table 3. Before surgery, Apmean measured at 1.75 ┬▒ 0.81 cm2 and after surgery increased to 2.24 ┬▒ 0.89 cm2 (p < 0.001); this difference was statistically significant. Moreover, OPJ also exhibited statistically significant changes, measuring from 1.03 ┬▒ 0.62 cm2 to 1.53 ┬▒ 0.77 cm2 (p < 0.001); Apmin measured from 0.99 ┬▒ 0.51 cm2 to 1.38 ┬▒ 0.69 cm2 (p = 0.003), and Vp measured from 14.45 ┬▒ 7.05 cm3 to 18.89 ┬▒ 7.72 cm3 (p < 0.001) after surgical treatment.
No significant changes were noted in the Apmax, which was 3.36 ┬▒ 4.02 cm2 before and 2.94 ┬▒ 1.25 cm2 after surgical treatment (p = 0.566). Furthermore, GL measurements did not exhibit significant changes either, measuring 1.57 ┬▒ 0.59 cm2 before and 1.71 ┬▒ 0.66 cm2 after surgical treatment (p = 0.148).
In addition to the acoustic pharyngometry data, correlation analyses were conducted to explore potential associations between tonsil hypertrophy, adenoid size, and the results of acoustic pharyngometry. To evaluate these relationships, Pearson correlation analyses were performed on various factors, including neck circumference, PTH, adenoid size, BMI, and the differences in pharyngeal volume (Diff_VP) and oropharyngeal junction area (Diff_OPJ) before and after surgery. The Pearson correlation coefficients and corresponding p-values are presented in Table 4. Upon examination of the correlation results, there is limited to no evidence of significant linear correlations between neck circumference, PTH, adenoid size, BMI, and the differences in pharyngeal volume (Diff_VP) and oropharyngeal junction area (Diff_OPJ) before and after surgery.
DISCUSSION
The results of this study revealed that children with ATH who underwent surgical removal of the tonsils and adenoids exhibited statistically significant changes in pharyngeal CSA and volume as reflected by acoustic pharyngometry. The OPJ, which represents the hypertrophied tonsils and is expected to be the most enlarged area after surgery, demonstrated a statistically significant difference in the CSA according to acoustic pharyngometry. Additionally, Vp, which can be used to assess the volume of the entire oropharynx, demonstrated a statistically significant increase after adenotonsillectomy and increases in Apmean and Apmin were objectively confirmed. And the changes observed in acoustic pharyngometry parameters after surgery, such as alterations in Apmean, OPJ, Apmin, and Vp, may not be strongly influenced by initial tonsil hypertrophy or adenoid size. Therefore, this study demonstrated that adenotonsillectomy is an effective treatment that helps enlarge the oropharyngeal area in children with OSA caused by ATH (Fig. 2).
The anatomy of the upper airways is complex. Furthermore, the dimensions of the upper airway are influenced by the flow-pressure interactions that occur in OSA. Therefore, to localize the decreased area of the upper airway before appropriate treatment can be administered is important.
Various diagnostic methods, such as fiberoptic endoscopy, cephalometry, computed tomography (CT), magnetic resonance imaging (MRI), and acoustic pharyngometry, enable the assessment of upper airway status and measurement of upper airway size [14]. Fiberoptic endoscopy has the advantage of providing a direct view of the upper airway in real-time and performing airway evaluation under local anesthesia in the outpatient clinic. However, fiberoptic endoscopy is difficult to perform in children, and the results are relatively subjective for both patients and examiners. Cephalometry is widely used to evaluate the sizes of the upper airway, soft tissues, and craniofacial structures. However, the procedure is a time-consuming process with cumulative radiation exposure, a well-known problem and limitation of two-dimensional imaging that does not enable volume or surface area measurements. Additionally, MRI and CT, which can reconstruct three-dimensional images, are used to overcome the limitations of two-dimensional imaging using cephalometry. However, the high costs and radiation exposure remain problematic.
Acoustic pharyngometry is a highly reproducible, non-invasive procedure that is closely associated with upper airway obstruction. Provided that the standard operating manual is adopted and maintained for each patient, acoustic pharyngometry is a useful verified test for evaluating pharyngeal CSA and volume [1,3,15]. When simple snorers and snorers with OSA among adults were examined using acoustic pharyngometry, snorers with OSA had a reduced pharyngeal CSA compared to simple snorers [5]. In children, upper airway narrowing, such as in those with ATH, is the most common cause of OSA [10]. In most previous studies, oropharyngeal airway status in children has been described based on the size of the tonsil. However, in other studies, no significant correlation between tonsil size and OSA severity in children was identified, although a significant relationship was observed between minimum pharyngeal CSA and SDB [7,16,17]. In addition, Di Francesco and Kreibich [18] reported that although pharyngeal volume was increased by adenotonsillectomy, the volume was not correlated with tonsil size. Therefore, to assess the severity of OSA in children, we suggest that the pharyngeal CSA or pharyngeal volume may be more meaningful than tonsil size.
One limitation of this study is that the results may not represent the upper airway status during the actual sleep state because the examination was performed while the participants were awake and in an upright sitting position. In addition, to clinically apply acoustic pharyngometry in children with OSA, further studies are needed to assess the relationship between acoustic pharyngeal measurements and the severity of the respiratory disturbance index or the success rate of surgical treatment and to define age-, sex-, and body mass index-matched pediatric control group data for acoustic pharyngometry. However, because this procedure is a non-invasive, safe, convenient, and reproducible method for assessing pharyngeal dimensions and volume in children with ATH, we suggest that acoustic pharyngometry has significant potential to provide an objective assessment of upper airway changes following surgery in children with SDB and ATH.