Environmental Noise and Sleep Disturbance: Night-to-Night Variability of Sleep/Wake Pattern
Article information
Abstract
Actigraphy is useful to assess sleep pattern of subjects for several days to several weeks, and collected sleep data is usually averaged out to know the general sleep pattern of each individual. However, intra-individual variability should be considered when assessing sleep patterns, with regard to the phenomenon of daily fluctuation. The aim of this study was to explore whether the mean sleep indices reflect intra-individual variability with regard to environmental noise. Indoor noise and sleep pattern were collected over 5 days, among 22 citizens of Ulsan Metropolitan city. We observed an association between environmental noise indices and various sleep indices such as sleep efficiency, number of awakenings, or fragmentation indices when we analyzed the data of 108 nights from 22 subjects. However, the significances were weakened when we analyzed noise and sleep/wake pattern after averaging out. In conclusion, we observed that the sleep/wake pattern over several days to weeks should not be averaged out when studied in relation with variable physiological phenomena, such as night-to-night variability.
INTRODUCTION
Sleep patterns are changing, and daily variations in sleep/wake cycles are common. When researchers assess the sleep pattern of subjects over several days or weeks, their sleep diary, actigraphy, or recently developed wearable device is helpful to measure daily variation in sleep/wake cycle for each individual [1]. Collected sleep data of several days or weeks is usually averaged out to know the overall sleep pattern of each individual. Therefore, in numerous researches about the association between sleep and physical or mental health, mean values of sleep indices, such as mean sleep latency, mean sleep efficiency, or mean total sleep time of each individual are usually calculated and used. However, we should consider that mean is just one of representative values and not the exact value itself. Intra-individual night-to-night variability should be considered when we assess sleep pattern with regard to certain phenomena which also fluctuate daily [2].
Extensively studied, it is well known that noise influences the physical and mental health. Environmental noise affects a person’s mental health [3], and night time road traffic noise increases the risk of cardiovascular complications [4,5]. It is also reported that noises related to road traffic, railways, and airplanes can disturb ones sleep [6,7]. Various noises especially disturb sleep of inpatients at hospitals [8,9]. In previous literatures, values of noise index were usually averaged out to present the status of environmental noise. However, since the daily variation in environmental noise is common, the mean values of noise indices are not the exact noise level at a certain time. The aim of this study was to explore whether mean sleep indices can reflect the intraindividual night-to-night variability with regard to environmental noise.
METHODS
This study was a part of “the Environmental Health Action Program”, to explore the association between environmental noise and mental or physical health, performed at Nam-gu in Ulsan metropolitan city in South Korea, between 2014–2016. The study was approved by the Institutional Review Board of Ulsan University Hospital, after obtaining informed consent from all subjects. The study area was selected from the Nam-gu, Ulsan metropolitan city, after completing the noise map and confirming the environmental noise around the residential area. In order to measure the actual noise level in the residential environment of the subject, a custom noise measuring apparatus was installed on the ceiling of the living room, and the noise was measured during the survey period. maximum sound level (Lmax) is the maximum noise level of the subject, day-night equivalent level (Ldn) is the weighted equivalent noise level of the daytime and nighttime noise, and night equivalent level (Lnight) is the quantitative noise level of the subject during the sleeping time. We enrolled 84 subjects from 18 Dec 2015 to 26 Feb 2016. Finally, 35 subjects were selected, after excluding 10 people in actigraphy, 17 people who did not write sleep patterns, 7 people who did not complete the questionnaires, and 15 people who had errors in measurement.
The xGT3X-BT of ActiGraph Corp. (Pensacola, FL, USA) and ActiLife software was used to analysis the sleep/wake patterns. Subjects were instructed to wear it on their non-dominant wrist for 5 nights. From the noise and sleep data collected for a total of 175 nights from 35 subjects (5 nights × 35 subjects), we selected data of 108 nights of 22 subjects, where at least 80% actigraphy sleep data was obtained of each night, to ensure that each period was not missing a large portion of data [10]. The Movement Index is the percentage of epochs with y-axis counts greater than zero in the sleep period, the Fragmentation Index is the percentage of one minute periods of sleep vs. all periods of sleep during the sleep period, and the Total Sleep Fragmentation Index is the sum of the Movement Index and the Fragmentation Index.
Subjective depressed mood, sleep disturbance, anxiety symptoms, stress, and quality of life during the past 1–2 weeks were assessed using Center for Epidemiologic Studies Depression Scale (CES-D) [11], Insomnia Severity Index (ISI) [12], state score of State-Trait Anxiety Inventory (STAI) [13], and a modified form of Stress Response Inventory (SRI-MF) [14].
Statistical Analysis
Statistical analyses were performed with SPSS ver. 19.0 for Windows (IBM Corp., Armonk, NY, USA). The level of significance was defined as p < 0.05 in two-tailed tests for all analyses. Initially, we performed the Spearman’s correlation analysis to explore the association between daily environmental noise indices and daily sleep indices using a total of 108 nights of 22 subjects. Next, the Spearman’s correlation analysis was repeated to explore the relationship of mean values of environmental noise indices during 5 nights, with mean values of sleep indices during 5 nights and rating scales scores.
RESULTS
A total of 108 nights from 22 subjects (7 men and 15 women) were analyzed. Their mean age was 42.8 ± 12.0 (range, 16–64) years. There was no significant difference between men and women in rating scale scores, noise indices, and sleep indices. Their mean Ldn was 62.9 ± 1.2 (range, 60.5–64.8) dB, mean Lnight was 43.4 ± 1.2 (range, 41.0–45.6) dB, and mean Lmax was 55.1 ± 9.2 (range, 42.1–74.0) dB. Among the 108 nights, Lmax of 61 nights (56.4%) were higher than 52 dB during the nights, which was classified as inter-floor noise during the night in South Korea [15]. Correlation analysis using 108 nights data revealed that Ldn negatively correlated with time in bed (p < 0.05) and total sleep time (p < 0.01), and positively correlated with wake time after sleep onset (p < 0.05), number of awakenings (p < 0.01), fragmentation index (p < 0.01), and sleep fragmentation index (p < 0.01). Lnight negatively correlated with time in bed p < 0.05), total sleep time (p < 0.01), and sleep efficiency (p < 0.05), and positively correlated with wake time after sleep onset (p < 0.05), number of awakenings (p < 0.01), movement index (p < 0.05), fragmentation index (p < 0.01), and sleep fragmentation index (p < 0.01) (Table 1).
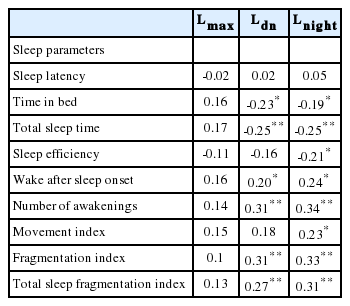
Spearman correlation between indoor noise and sleep parameters (108 days)
Analysis of the association of mean values of environmental noise indices with mean values of sleep indices and rating scales scores revealed no significant association between noise indices and rating scales scores, except for the positive correlation between mean Ldn and STAI-anxiety total score (p < 0.05). Among sleep parameters, just number of awakenings, fragmentation index, and sleep fragmentation index were positively correlated with mean Ldn or mean Lnight (all p < 0.05) (Table 2).
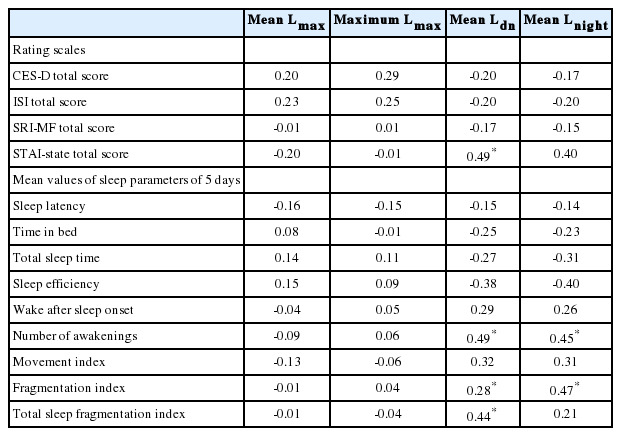
Spearman correlation of mean values of indoor noise with mean values of sleep parameters and rating scales scores (22 subjects)
DISCUSSION
The results of this study indicate that daily environmental noise indices were associated with various daily sleep indices such as sleep efficiency, number of awakenings, or fragmentation indices, when analyzed using daily sleep/wake pattern and environmental noise data. However, those associations were weakened when analyzed using an individual’s means of environmental noise indices and sleep indices during 5 days. Actigraphy or other recently developed wearable devices record the sleep/wake pattern, and are useful in assessing sleep/wake patterns over several days or weeks. The whole data is usually averaged out to explore the overall sleep/wake pattern. However, the association between noise and sleep was weakened in this study when we analyzed noise and sleep/wake pattern after averaging out the data of 5 days. Undoubtedly, the sleep indices need to be averaged out whilst studying the association between sleep/wake patterns with a certain physiological phenomenon such as metabolic syndrome or glucose intolerance, which are expected to be induced long-term. However, the sleep/wake pattern and environmental noise can differ and have night-to-night variability, and therefore we should consider not to average the values of sleep indices nor conceal important data [2], especially when exploring the association of sleep/wake cycle to certain phenomena which also has daily variability.
In this study, sleep indices were significantly associated with Ldn and Lnight, but not Lmax of noise indices. The Ldn or day-night average sound level (the average noise level over a 24-hour period) with artificially increased by 10 dB of noise between 10 pm and 7 am, was reported to be related with sleep disturbance [16]. Also, the Lnight was reported to be associated with sleep disturbance [6]. However, Lmax was not significantly associated with sleep indices in this study. It can be expected that maximum noise level was not too high to disturb the sleep of the subjects in this study.
The small sample size of 22 subjects was one limitation of this study. The time difference between rating scales and objective measurement was another limitation. The subjects were instructed to rate their sleep, anxiety, or depression symptoms during the past 1–2 weeks, but noise and sleep/wake pattern were measured after the day of rating scale assessment. Another limitation is that sleep disorders, such as restless legs syndrome or obstructive sleep apnea syndrome, were not excluded in this field survey study. Despite the limitations, we observed that environmental noise levels can disturb an individual’s sleep. We also observed that sleep/wake patterns during several days to weeks should not be averaged out when studied in relation with certain variable physiological phenomena and having night-to-night variability.
Acknowledgements
This study was supported by the Korea Ministry of Environment (MOE) as “the Environmental Health Action Program (grant number: 2014001350001).”
Notes
Conflicts of Interest
The authors have no financial conflicts of interest.